B2B Marketing Budgets: What Companies Spend in 2026 and How to Set Yours
B2B marketing budgets run 3% to 15% of revenue, with most companies between 6% and 12%. See the 2026 benchmarks by company size and industry, where the money goes, and how to set a number you can defend.

Your CFO asks what marketing should cost next year. You say twelve percent of revenue. She asks why twelve. You say that is what the benchmarks show.
That is the moment the budget conversation gets lost, and it gets lost every year in thousands of B2B companies. A benchmark is not a reason. It is a sanity check you run after you have done the math, not a number you hand over instead of doing it.
Here is what B2B companies spend in 2026, where the money goes, and how to build a number that survives the follow-up question.
How much do B2B companies spend on marketing?
B2B companies spend between 3% and 15% of revenue on marketing, with most landing between 6% and 12%. The spread is that wide because revenue size, business model, and growth target move the number more than industry does.
The 2026 anchor points:
- All marketing budgets average 7.8% of company revenue, up a tenth of a point from 7.7% in 2025, according to the Gartner 2026 CMO Spend Survey of 401 marketing leaders.
- B2B product companies sit at 7.0%. B2B services companies sit at 10.1%. Services firms sell expertise that has to be demonstrated before it is bought, so they pay more to demonstrate it.
- Budgets have been effectively flat for four years. The story of 2026 is not more money. It is the same money doing more jobs.
One caveat that matters more than the numbers: Gartner’s sample skews heavily toward companies above $1 billion in revenue. If you run a $30 million manufacturer, that average is describing someone else’s problem. Use the revenue-size table below instead.
B2B marketing spend as a percentage of revenue, by company size
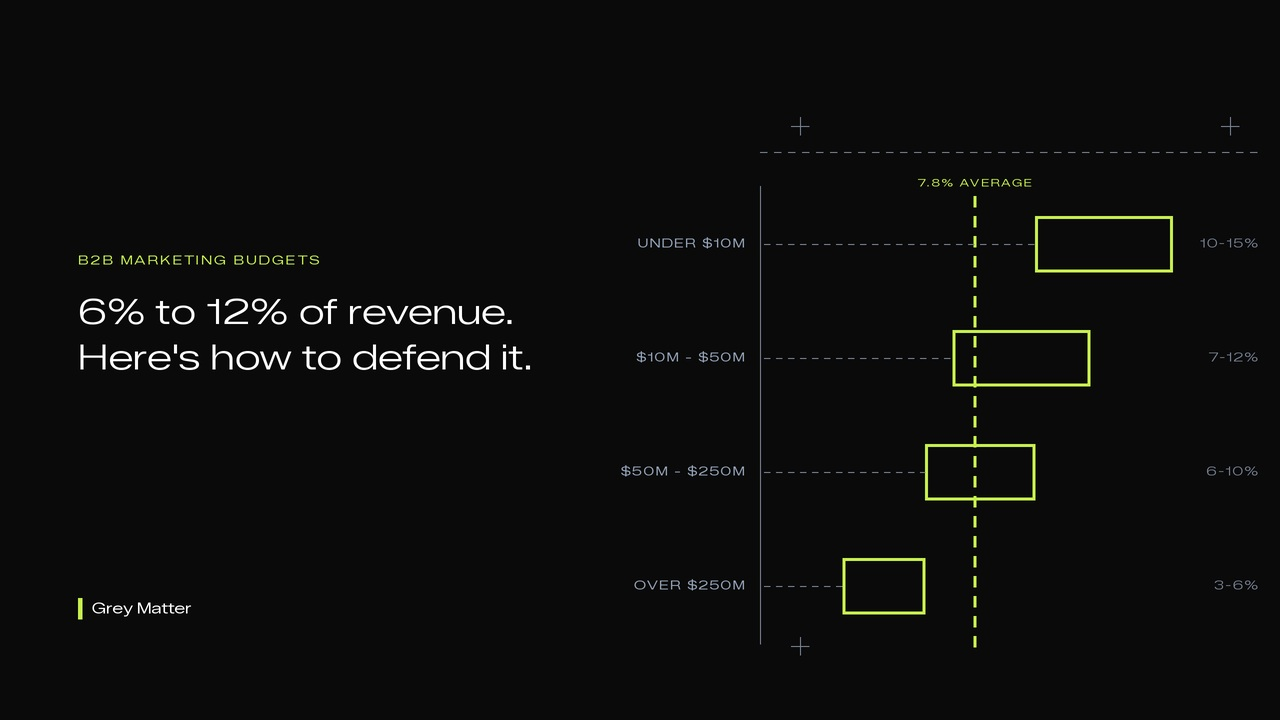
Smaller companies spend a higher share of revenue because they are buying awareness they do not have. Larger companies spend a smaller share because brand equity and installed base do some of the work for free.
| Annual revenue | Typical spend | What the money is buying | Absolute budget at the midpoint |
|---|---|---|---|
| Under $10M | 10% to 15% | Website, demand capture, outsourced execution | $1.25M on $10M revenue |
| $10M to $50M | 7% to 12% | Predictable pipeline, positioning, sales enablement | $1.9M on $20M revenue |
| $50M to $250M | 6% to 10% | Multi-segment campaigns, martech, specialized teams | $12M on $150M revenue |
| Over $250M | 3% to 6% | Brand leadership, global sales support, ABM at scale | $18M on $400M revenue |
Watch what happens to the percentage and the dollars at the same time. The $400 million company spends less than half the share of the $10 million company and fourteen times the money. Percentages tell you whether you are in range. Dollars tell you what you can actually build.
What do B2B marketing budgets look like by industry?
Professional services: 5% to 8%. Referral and relationship-driven, with marketing supporting business development rather than replacing it.
B2B SaaS: 10% to 15%. Land-grab economics. Spend is justified by lifetime value, not this quarter’s revenue.
Manufacturing: 3% to 6%, and climbing. This is the most underfunded category in B2B, usually because the budget was set when the sales model was reps and trade shows.
Distribution and industrial services: 4% to 7%. Heavy on search, light on brand.
If you are a manufacturer looking at 3% and feeling comfortable, run one check before you relax. Ask what share of your pipeline came from a source that did not exist at your company five years ago. If the answer is none, the 3% is not efficiency. It is a decision to let the market come to you.
Where the money goes inside the budget
This is where most benchmark articles stop being useful, because the split has moved significantly since 2023.
| Category | Typical range | What lives here |
|---|---|---|
| People and agencies | 38% to 46% | Salaries, agency retainers, contractors, strategy, content, design, campaign management |
| Working media | 28% to 34% | Paid search, paid social, display, retargeting, sponsorships, PR |
| Martech and data | 18% to 24% | CRM, marketing automation, analytics, attribution, SEO tools, enrichment, AI tooling |
| Events | 5% to 15% | Trade shows, conferences, webinars, field marketing |
Three things about that table are worth arguing over in your own planning meeting.
Your largest marketing expense is the team, not the ads. People and partners run 38% to 46% of the budget in most B2B companies. Leadership consistently guesses this wrong, assumes media is the big line, and then cuts headcount to fund campaigns nobody is left to run.
Paid media is the only line growing. Gartner’s 2026 data puts paid media at 30.6% of budget and rising, while martech’s share has fallen to a five-year low near 19.4%, down from 26.6% in 2021. Software got cheaper per seat and consumption-based. Attention got more expensive.
AI is now a budget line, not a footnote. CMOs allocate 15.3% of marketing budget to AI initiatives in 2026. The organizations Gartner rates as AI-ready allocate 21.3%. Only 30% say they are ready to scale it. If AI spend is not a named line in your plan, it is being paid for quietly out of martech or agency fees, which means nobody is measuring what it returns.
How to set a B2B marketing budget you can defend
Benchmarks validate. Funnel math decides. Work it backward in five steps.
- Start with the revenue target, not last year’s budget. How much new revenue does marketing need to source? Not influence. Source.
- Convert revenue to closed-won deals. New revenue target divided by average deal size. A $6 million target at $120,000 average deal size is 50 deals.
- Convert deals to opportunities to leads. Use your actual close rate and your actual lead-to-opportunity rate, pulled from the CRM, not from an industry report. At a 22% close rate, those 50 deals need 227 opportunities.
- Price the pipeline. Multiply required leads by your blended cost per qualified lead. If you do not know that number, stop here and go find it. Everything downstream is fiction without it.
- Check the result against the benchmark ranges above. This is the only place a benchmark belongs.
Then read the gap honestly:
- Your math lands inside the range. Good. Your goals and your spend are talking to each other.
- Your math lands far above the range. Either your conversion rates are broken or the growth target is not funded by this business. Both are fixable. Neither is fixed by approving the number.
- Your math lands far below the range. You are either unusually efficient or you are underinvesting and calling it discipline. Check your win rate against last year before you celebrate.
Bad budget answer: “We’re spending 9% because that’s the benchmark for our industry.”
Good budget answer: “We need $6M in sourced revenue. That’s 50 deals, 227 opportunities, roughly 1,100 qualified leads at our current rates. At $1,450 per qualified lead that’s $1.6M, which is 8% of revenue and sits inside the mid-market range. Here’s what we cut if we fund $1.2M instead.”
One of those survives a board meeting.
Use our B2B Marketing Budget Calculator to work backward from your revenue target, or read more about building a B2B marketing plan that survives the year and calculating ROAS for B2B lead generation.
The benchmark trap
Average includes everyone. It includes the company that overspent on a rebrand nobody asked for, and the company that has not updated its website since 2019 and is quietly losing deals it never hears about.
Matching the average gets you average results. That is the entire promise, and it is worth saying out loud, because “we’re at benchmark” gets used as evidence that the budget is working when it is only evidence that the budget is normal.
The companies that hit their number consistently do two things differently. They fund the channels their pipeline data says are working, even when the split looks nothing like the table above. And they defund the ones that are only justified by habit, which is usually one legacy trade show and one piece of software.
Your budget is a set of bets. The benchmark tells you whether you are betting a normal amount. It cannot tell you whether you are betting on the right things.
Frequently asked questions
What percentage of revenue should B2B companies spend on marketing?
Most B2B companies spend between 6% and 12% of revenue. Companies under $10 million typically spend 10% to 15%, while companies over $250 million typically spend 3% to 6%. Gartner’s 2026 average across all marketing budgets is 7.8% of revenue.
How much do B2B services companies spend compared to product companies?
B2B services companies average 10.1% of revenue. B2B product companies average 7.0%. Services firms spend more because expertise has to be demonstrated through content, research, and thought leadership before it gets bought.
What is the biggest line item in a B2B marketing budget?
People and agencies, at 38% to 46% of total budget. Working media is second at 28% to 34%. Most leadership teams assume the order is reversed.
How much of a marketing budget should go to AI in 2026?
CMOs allocate an average of 15.3% of marketing budget to AI initiatives. The most AI-ready organizations allocate 21.3%. The more useful question is whether AI spend is a named line in your plan or is being absorbed invisibly into martech and agency fees.
Should marketing budget be set as a percentage of revenue or from pipeline math?
Pipeline math sets the budget. The percentage checks it. Start from the sourced revenue target, work back through close rate, opportunity rate, and cost per qualified lead, then compare the result to the benchmark range to confirm it is realistic.
What is a reasonable marketing budget for a $25 million B2B company?
Between $1.75 million and $3 million, based on the 7% to 12% mid-market range. Where you land inside that range depends on growth target, sales cycle length, and how much of your pipeline currently comes from referral.
The question your CFO is actually asking
She is not asking what other companies spend. She is asking what happens to revenue if she says yes, and what happens if she says no. The benchmark answers neither.
Bring the funnel math. Bring the benchmark as the second slide.
Not sure whether your current spend matches your growth goals? Our B2B growth diagnostic reviews your allocation against both the benchmarks and your own pipeline math, and tells you which line items are carrying the number. Get a free B2B marketing audit, or run your revenue through the B2B Marketing Budget Calculator first.
Want a strategy built around this? Get a free B2B marketing diagnostic →